Students, opting for standardized tests, often think that the ACT score is like a school exam. They believe the score will be calculated with percentages and fixed grading. But ACT Scores are with a conversion system. It converts your number of correct answers into a standardized scale of 1-36.
The conversion changes slightly every year with each test. This is for keeping the test fair. This is why students often look for a reliable ACT score chart that will help them understand how many correct answers result in what specific score.
What an ACT Score Chart Shows
An ACT score chart converts raw scores into scaled scores. It generally has four columns, one for each ACT Section. It also shows how many correct answers correspond to a scaled score.
A chart might show, for example, that:
- Getting 65 out of 75 in English might convert to a 34
- Getting 55 out of 60 in Math might convert to a 32
- Getting 38 out of 40 in Reading might convert to a 35
- Getting 34 out of 40 in Science might convert to a 31
However, the exact conversion will always be slightly different with each release of the exam. ACT uses a distinct process called equating, so every test comes with its own specific scoring table. A harder exam may offer a slightly better scaled score for the same raw score. Easier exams will require higher raw scores for top scaled scores. This ensures score consistency over time.
You don’t have to do guesswork with the ACT score chart. Students can understand their ACT Practice Test results and can set realistic score targets. Whether you’re aiming for a 25, 30, or 34+, knowing the scoring structure gives you control over your study strategy.
Why ACT Score Charts Change?
ACT uses test equating. It is a statistical method that adjusts scoring. Its purpose is to make the test fair for every test taker, regardless of when the test was taken. It represents the same level of performance.
Why this matters
- A raw score of 52 in Math might produce a 30 on one test form.
- The same raw score might produce a 29 or 31 on another.
- This prevents “easy test inflation” and “hard test penalties.”
This dynamic scoring system protects fairness and ensures students of different years will be judged on equal footing. This is why all ACT Score Charts you see online are sample charts, not universal ones.
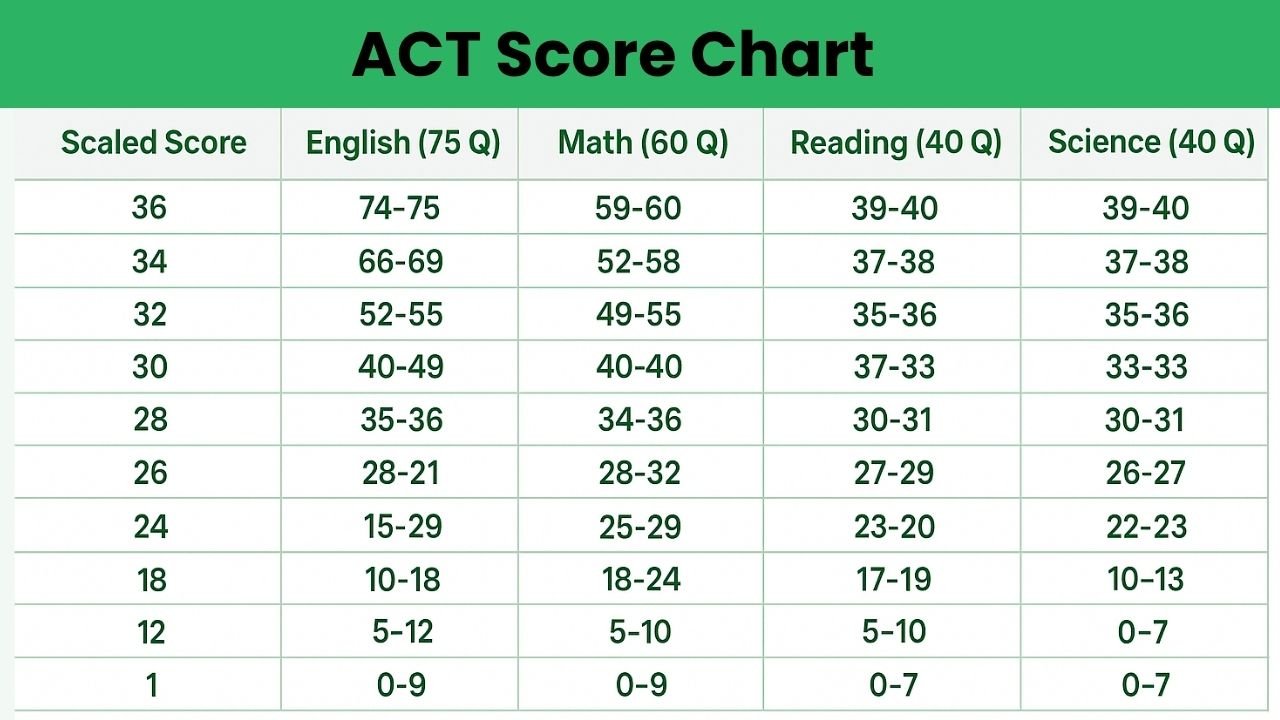
Sample ACT Score Chart
You cannot find a definite ACT score chart online because it doesn’t exist. However, you can check this simplified, original chart showing how raw scores may convert to scaled scores. This is only an educational example, not an official ACT chart.
Scaled Score | English (75 Q) | Math (60 Q) | Reading (40 Q) | Science (40 Q) |
36 | 74–75 | 59–60 | 39–40 | 39–40 |
34–35 | 70–73 | 56–58 | 37–38 | 37–38 |
32–33 | 66–69 | 52–55 | 35–36 | 34–36 |
30–31 | 62–65 | 49–51 | 33–34 | 32–33 |
28–29 | 58–61 | 45–48 | 31–32 | 30–31 |
26–27 | 54–57 | 41–44 | 28–30 | 27–29 |
24–25 | 50–53 | 37–40 | 25–27 | 24–26 |
22–23 | 46–49 | 33–36 | 23–24 | 22–23 |
20–21 | 41–45 | 29–32 | 20–22 | 19–21 |
18–19 | 36–40 | 25–28 | 17–19 | 16–18 |
16–17 | 31–35 | 21–24 | 15–16 | 14–15 |
14–15 | 26–30 | 17–20 | 13–14 | 12–13 |
12–13 | 21–25 | 13–16 | 11–12 | 10–11 |
10–11 | 17–20 | 10–12 | 9–10 | 8–9 |
1–9 | 0–16 | 0–9 | 0–8 | 0–7 |
This is an example chart, not a definite one, but it mirrors how the original ACT chart looks.
How ACT Scoring Works?
The ACT consists of four compulsory sections:
- English
- Math
- Reading
- Science
You have to solve a fixed number of questions, and they follow the same scoring principle:
Raw Score (Correct Answers Only)
Your raw score is typically the total number of correct answers. There is no penalty for wrong answers, so following the guesswork is better than leaving a question blank.
Scaled Score (1–36)
Every raw score is converted into a scaled score between 1 and 36. This conversion is designed to keep the score consistent throughout different dates, even if some tests are a little harder.
Composite Score (Average of Four Sections)
The resulting composite Average ACT Score is the average of the four scaled section scores. It is rounded to the nearest whole number.
ACT Writing (Essay) – Scored Separately
If you take the optional ACT Writing Test:
- Your essay score is reported from 2–12.
- It will not impact your composite score.
- Some colleges require or recommend it, but many do not.
This scoring structure makes the ACT predictable and standardized across years, ensuring fairness for current and future test-takers.
How to Use an ACT Score Chart for Prep?
Learning the ACT score chart is not just about score understanding, but it can also help you in an efficient ACT prep. Here is how:
Set Raw-Score Targets
If you are planning a 30 composite score, then don’t go for perfection. Learn what raw ACT score range can produce a 30 in each section.
Track Practice Tests More Accurately
Instead of worrying about your score percentage, convert your raw scores to scaled equivalents to measure real progress. Use ACT Practice Test results to understand at what percentile you are falling with your score.
Identify Score Gaps Strategically
If you consistently miss the upper-level questions in Reading but score strongly in English, that insight shapes your study plan.
Improve Time Management
A score chart helps you see how many questions you can miss while still hitting your target score. This helps you pace better.
Use Guessing to Your Advantage
ACT Test Calculator isn’t needed for scoring, but make sure you attempt every question. Even educated guessing improves your scaled score.
Check your official resources for upcoming ACT Test Dates and understand When Do ACT Scores Come Out after your exam. This helps you plan study schedules and register for tests efficiently.

FAQs About ACT Score Chart
Let’s answer your questions about the ACT score chart.
How many correct answers do I need for a 30 on the ACT?
Usually, a mix of upper-mid raw scores across sections; exact numbers vary by test form.
Is the ACT curved?
Not like a classroom, but ACT uses equating to keep the testing fair instead of creating a competitive curve.
Does the ACT penalize wrong answers?
No, there is no penalty, so guessing is recommended.
Does the ACT Writing score affect the composite?
No. The essay scoring is separate and does not change the composite test scores.
Why does every ACT Score Chart look different?
Because each test form uses its own raw-to-scaled conversion based on difficulty.
How is the ACT composite score calculated?
It is the rounded average of four scaled section scores.
Do colleges prefer certain ACT sections more?
Most colleges look at the composite score but also note individual section strengths.
Bottom Line
The ACT Score Chart is a helpful tool for efficient preparation. The chart helps the students to set achievable goals and measure progress accurately. It also explains the raw score conversion into scaled scores and how the scale scores combine to form the composite. With proper use, it guides students in both study strategies and confidence on test day. This ensures that students will be more comfortable the exam day. Will take the ACT Test with focus and be informed mind.
For specialized support, Ivy Test Prep and Ivy Learning provide personalized guidance and practice for students looking to maximize their ACT performance.